From Signal to Decision
in Under 60 Seconds
This is what your experience looks like. You open Options Flow, spot unusual activity, validate the signal, understand the context, and make an informed call. Here's the journey — step by step.
The Signal: You Spot Something Unusual
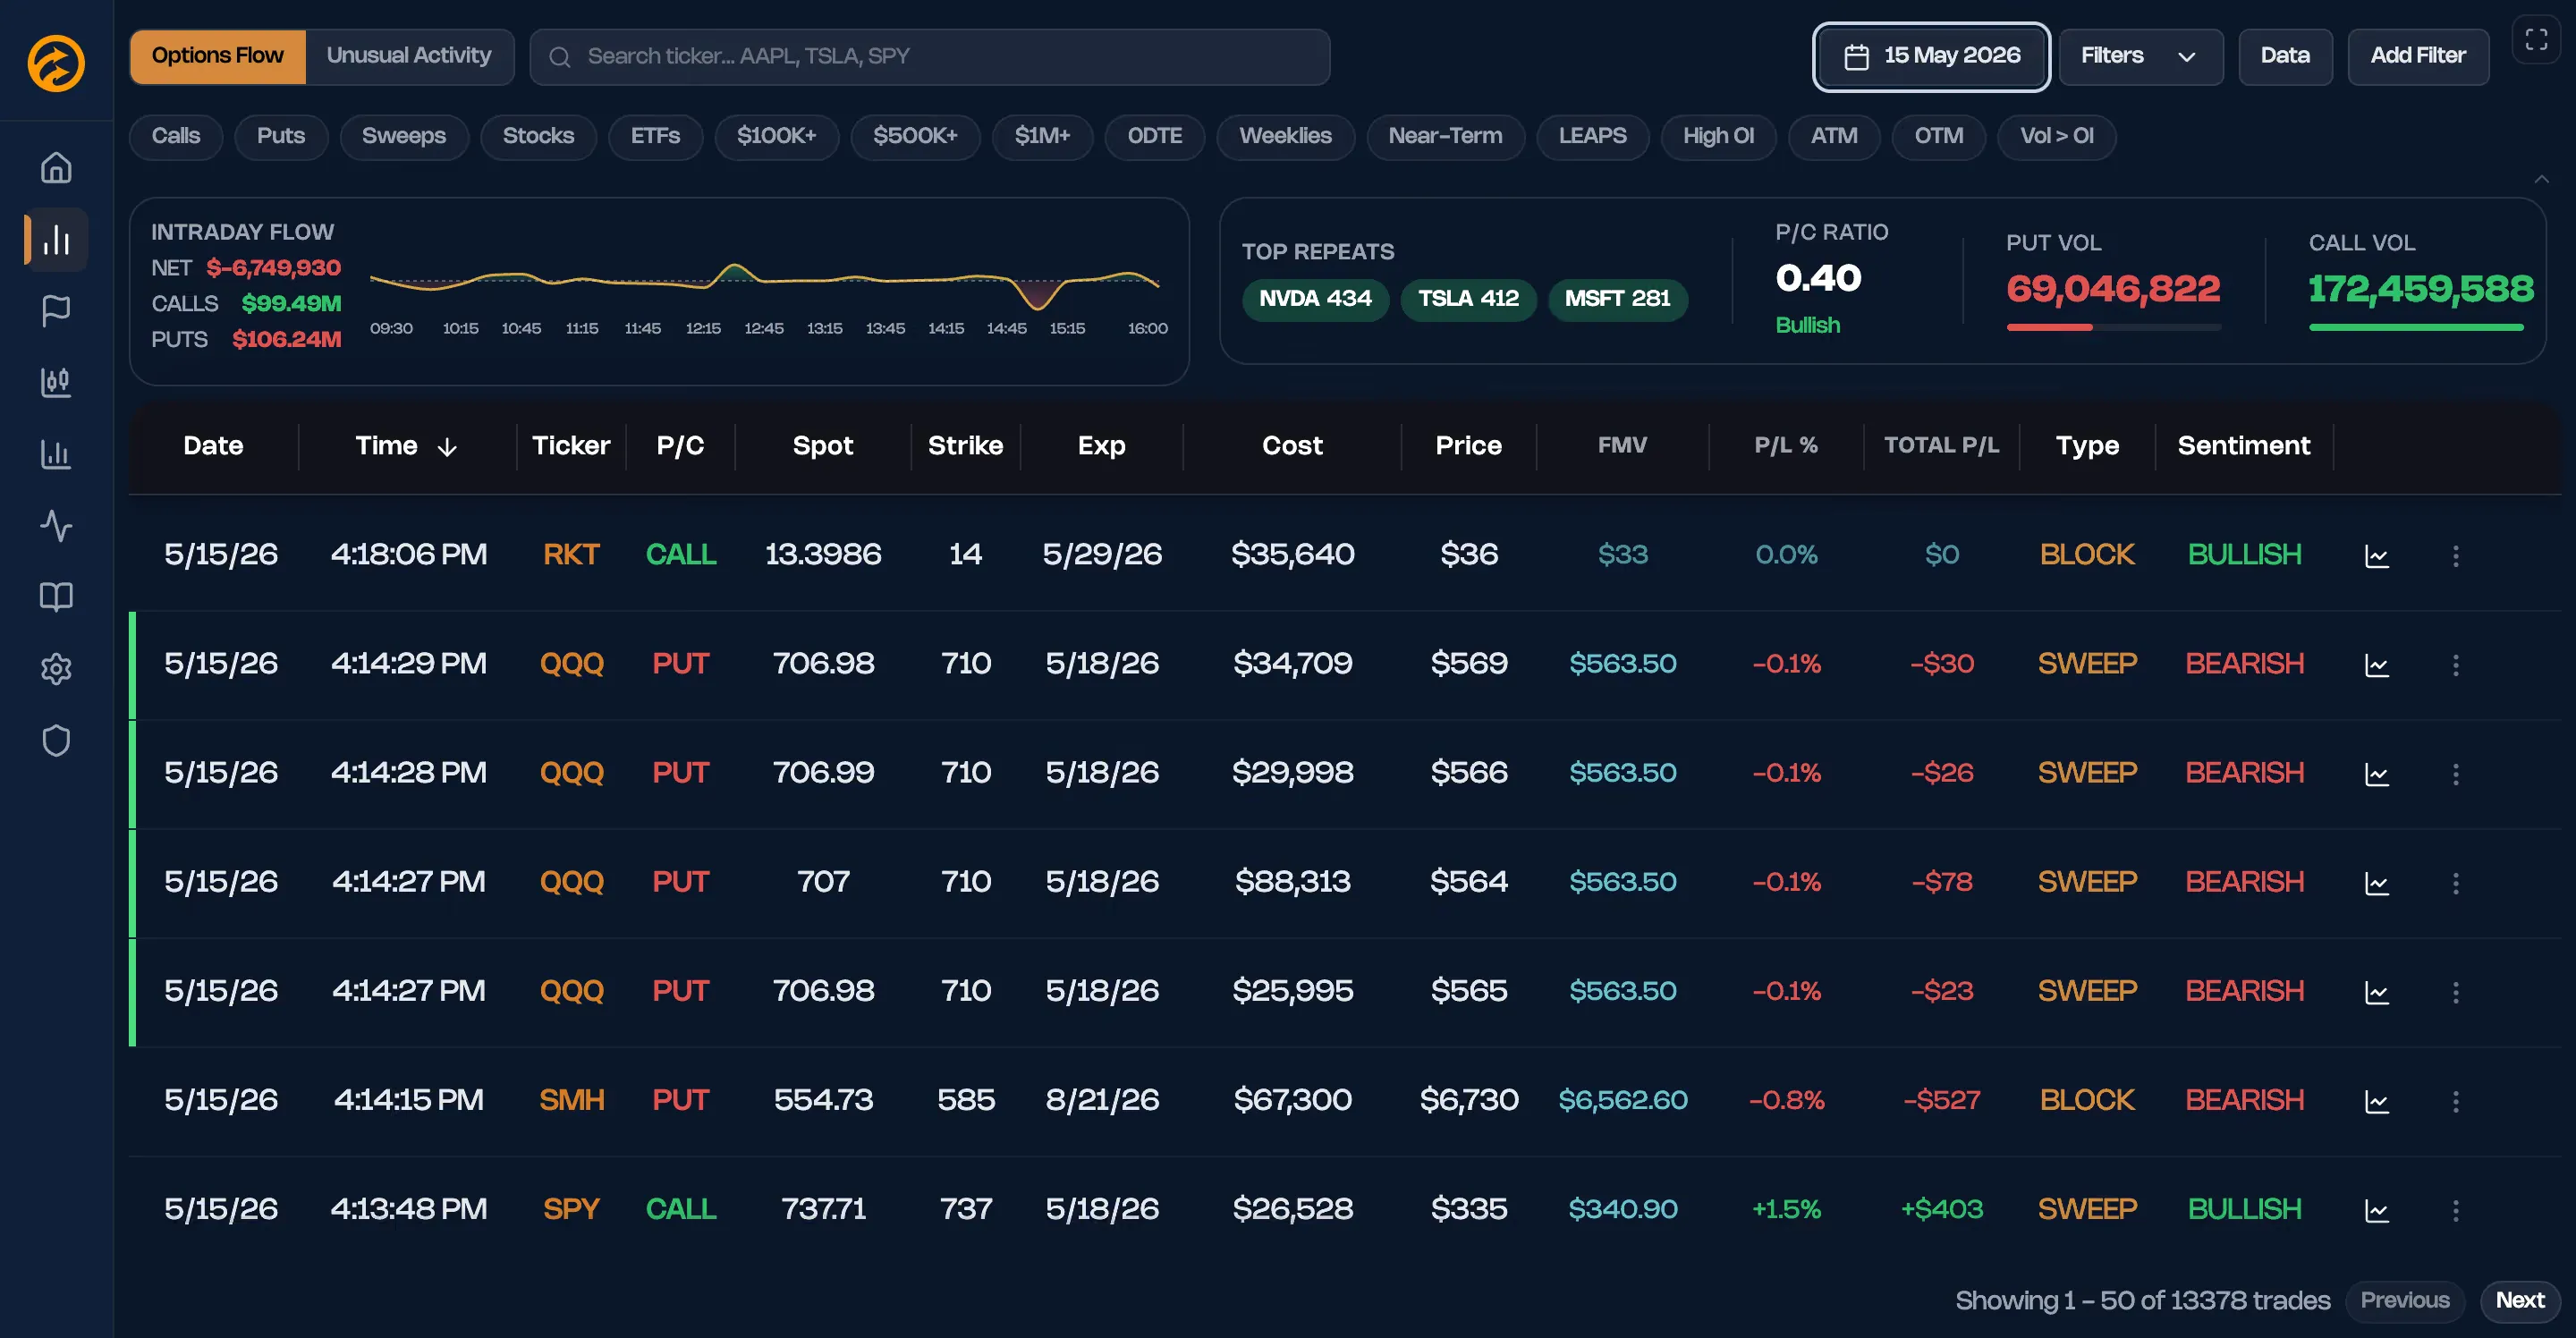
You open the Options Flow scanner. The flow table is live, updating every second with new prints from every U.S. exchange. You're scanning for what stands out — large premium, aggressive execution, unusual volume against open interest.
There — a trade catches your eye. $250k premium, aggressive sweep, hit the ask across multiple exchanges. The P/L column is already green. Someone wanted in, and they wanted in now.
Built-in filters remove noise — retail size, routine hedges, market maker activity. What you see is what matters.
Options Flow & Unusual Activity feeds with five Signal Filters — categorized signals help you prioritize. You know the type before you even click.
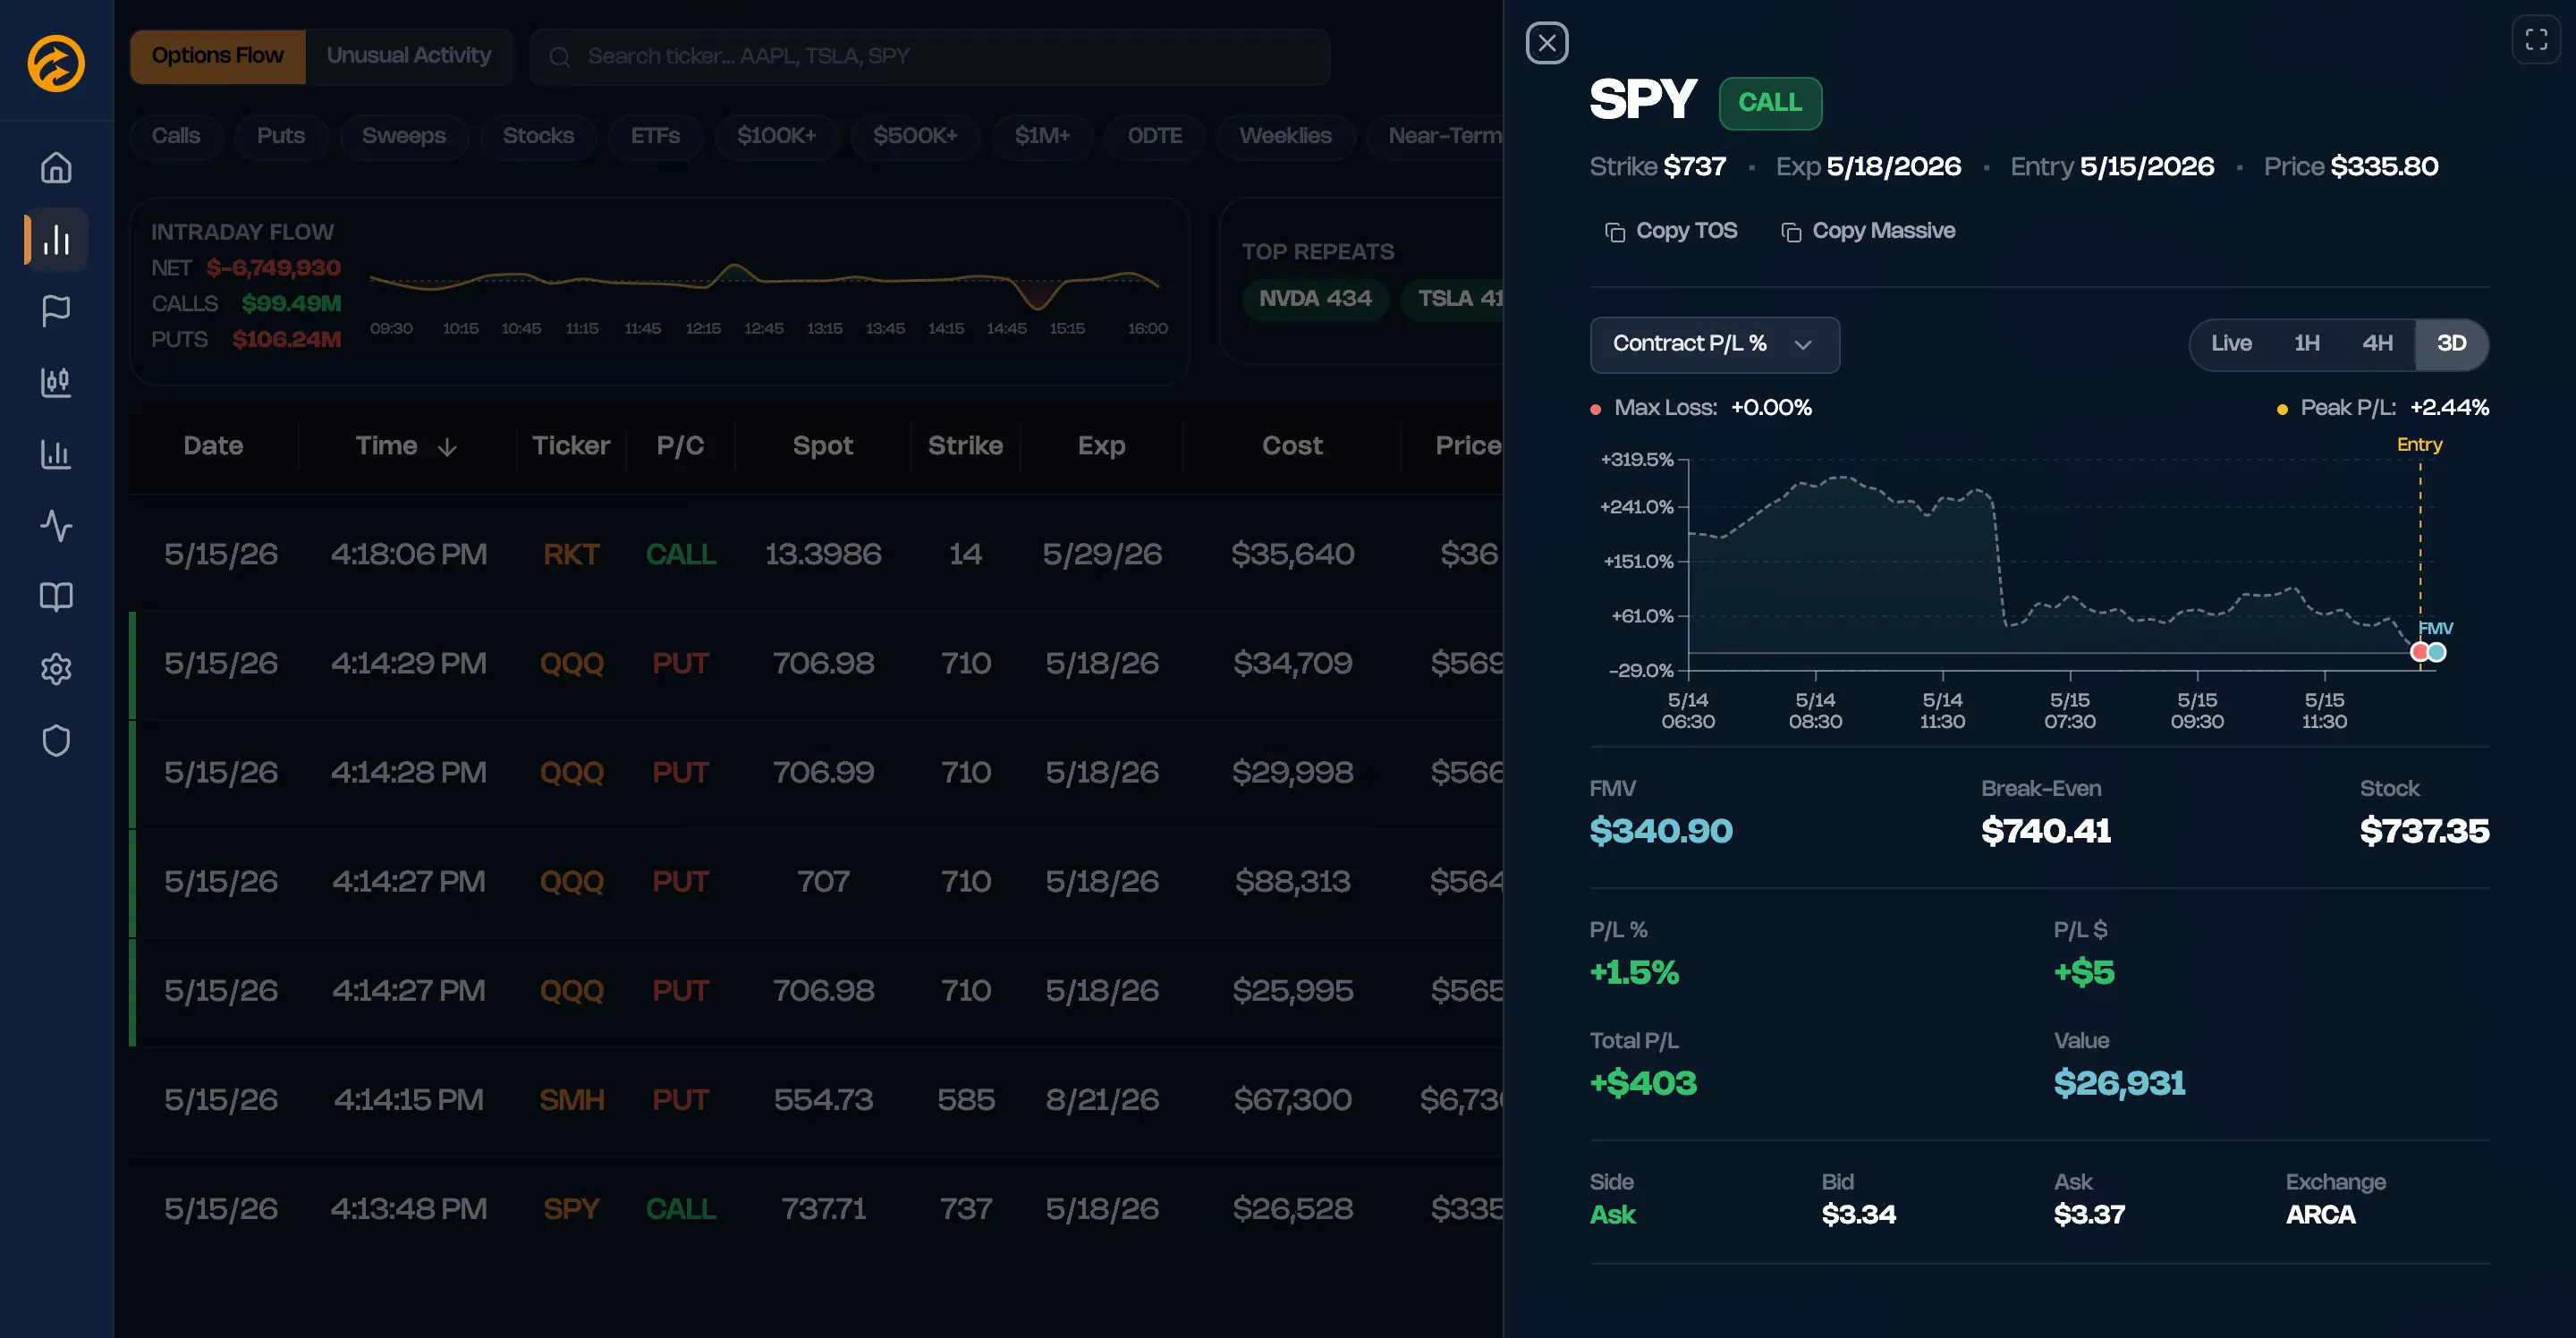
The Deep Dive: You Open Trade Analysis
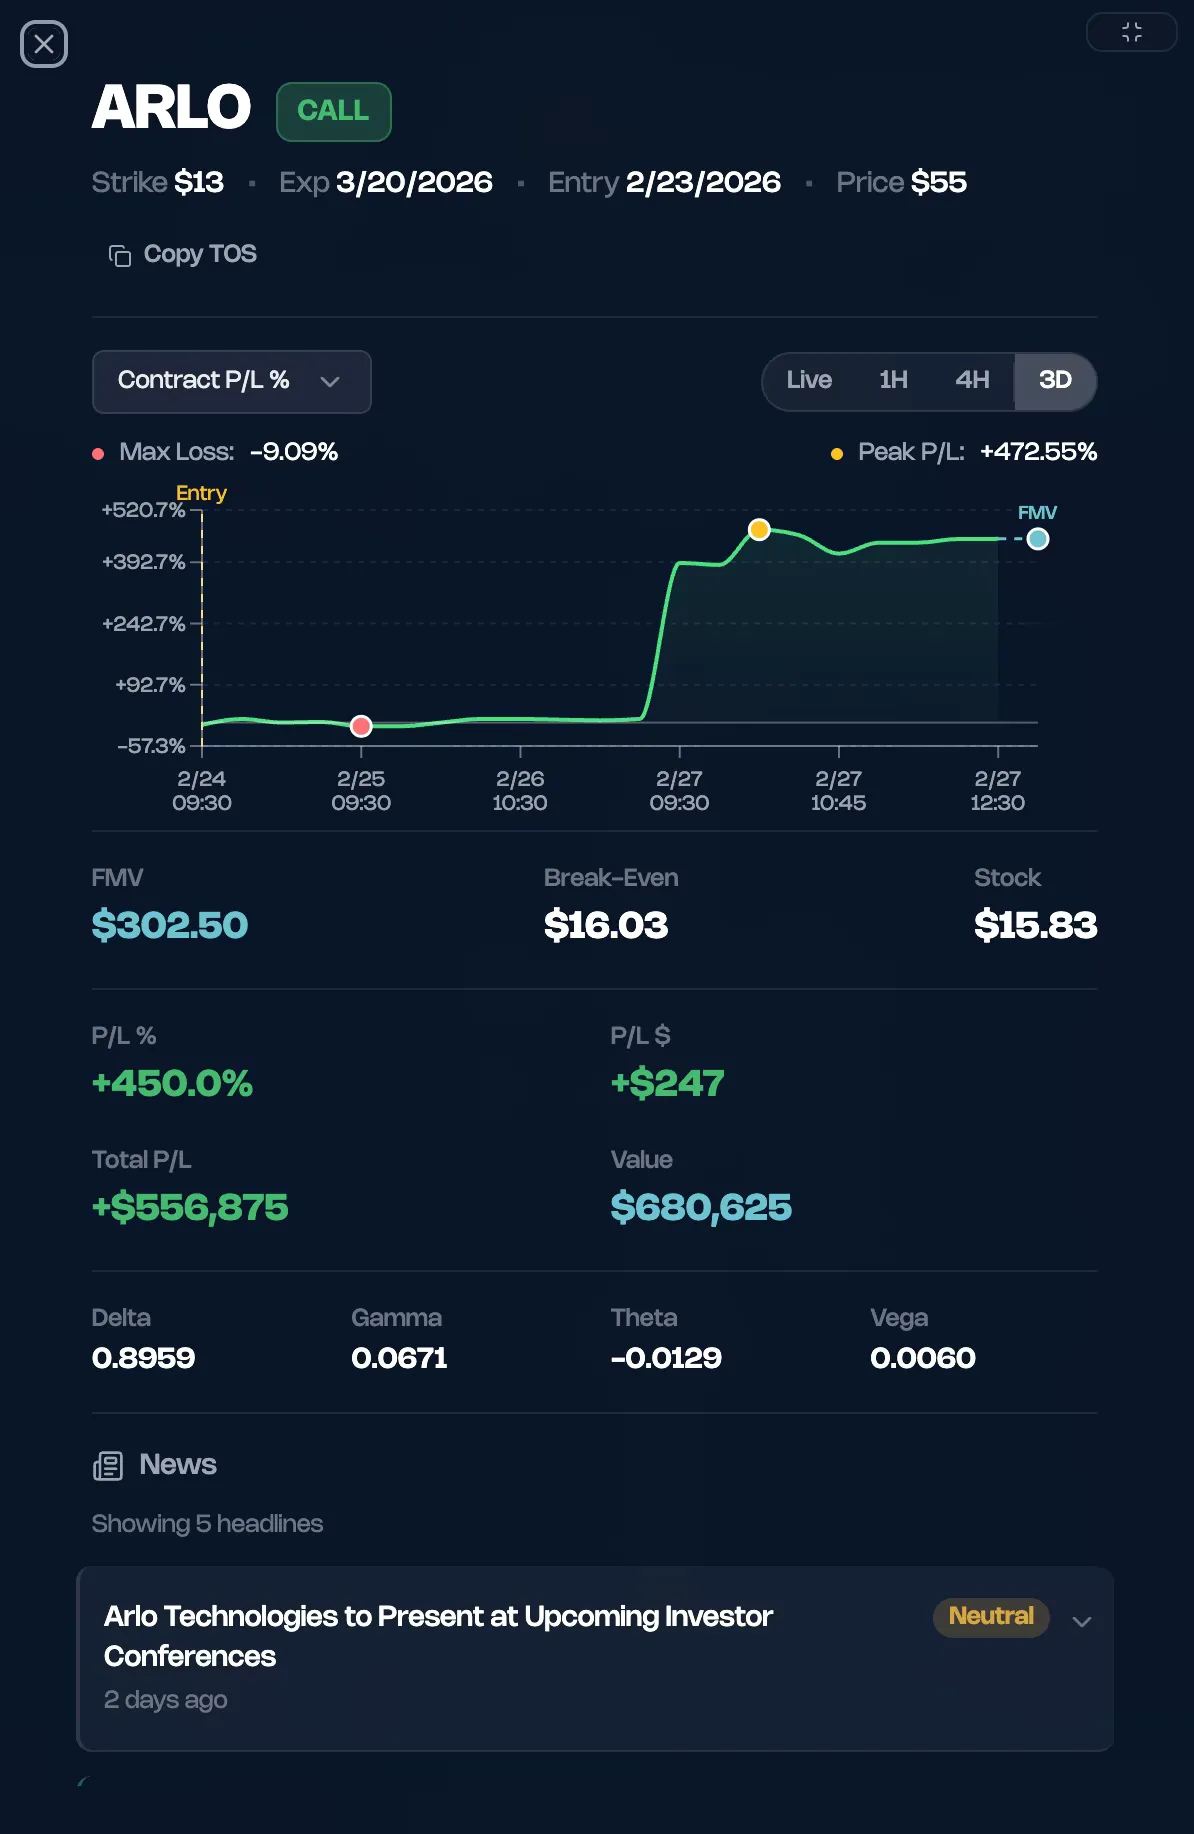
You click the trade. The Trade Analysis workspace loads immediately — no switching tools, no manual lookups. You see the full picture: entry price, current fair market value, real-time P/L tracking, contract details, strike, expiry, who's buying.
The chart tabs load. Flow tab shows accumulation patterns. P/L tab shows how the position performed intraday and since entry. This isn't just data — it's the story of how the trade developed.
Six chart tabs in one workspace: Flow, P/L, Greeks, Heatmap, GEX, and Open Interest.
Historical performance visible on any past signal. See how prior flows in this ticker played out.
The Context: You Check Market Structure
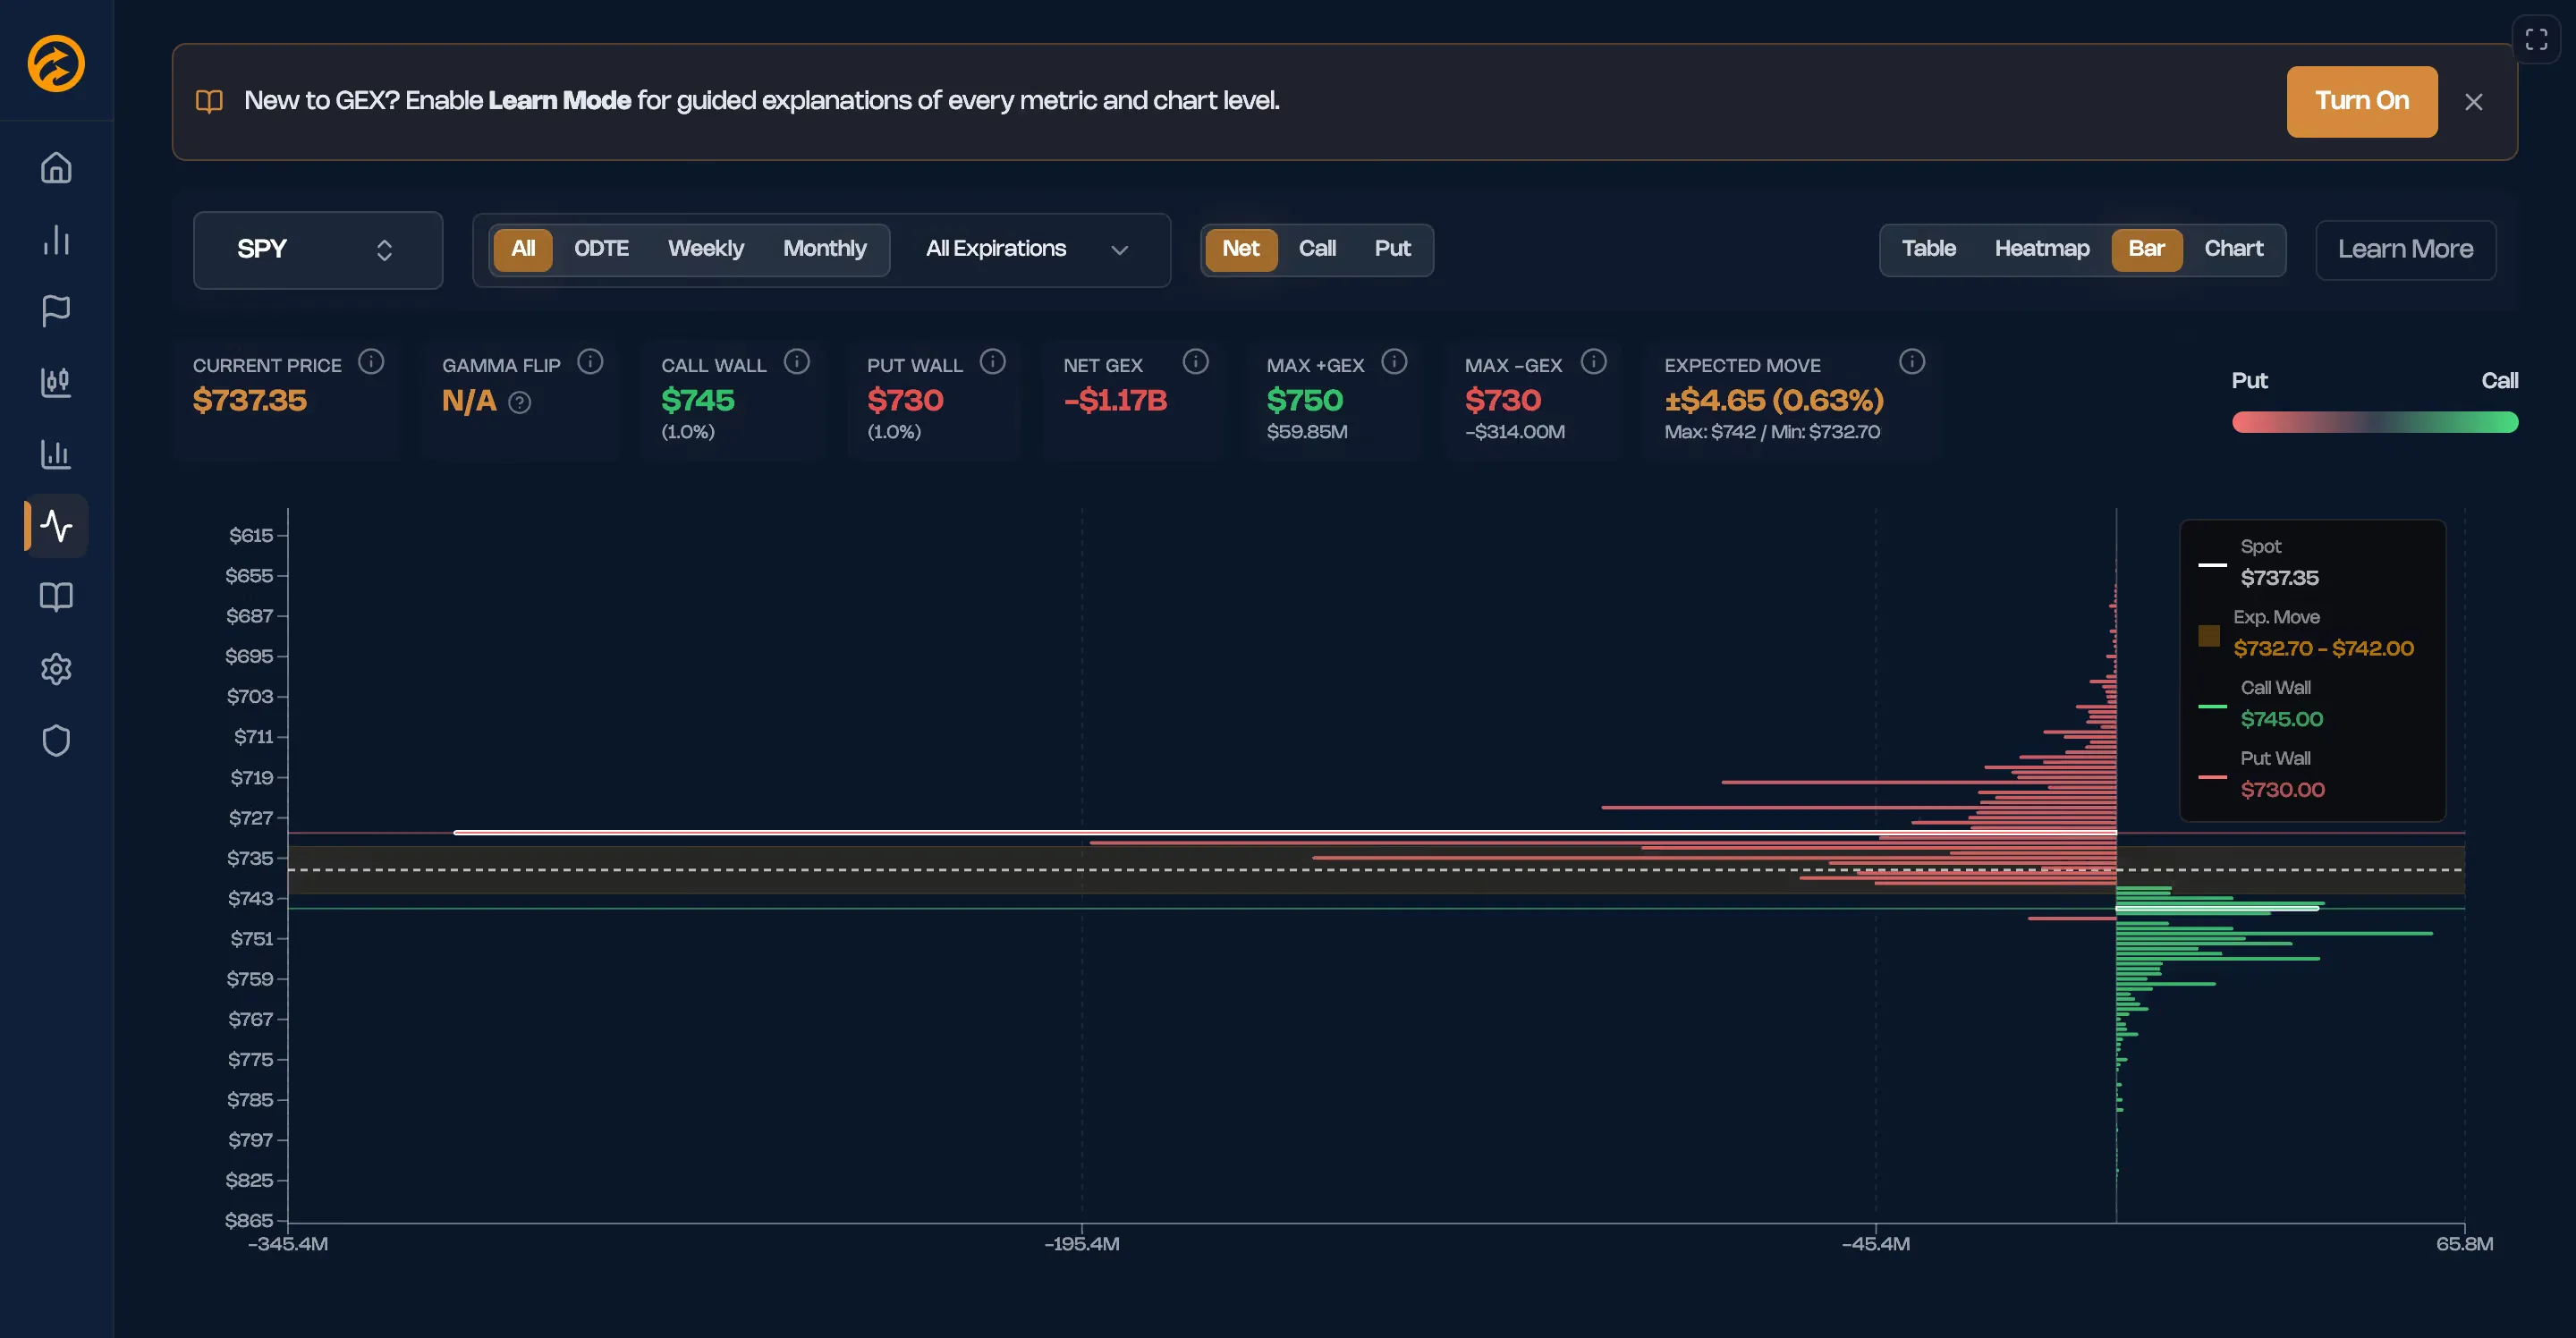
You switch to the GEX tab. You want to know where the walls are — where dealer positioning creates support or resistance. Is gamma exposure aligned with the flow signal? Are there large concentrations near the current price that might create a magnet or repulsion zone?
The GEX bar chart loads. Large positive gamma exposure sits just below the current price. That's a floor — dealers will buy dips to hedge their books. The flow signal is bullish, and dealer mechanics are aligned. The context confirms the signal.
Gamma Exposure (GEX) shows where market makers are likely to buy or sell as price moves.
Price magnetism — when positive GEX is concentrated at a strike, that level becomes a gravity well for price action.
The Confluence: Signals Align
Multiple signals are aligning. The aggressive flow you spotted is now validated by dealer positioning. Unusual volume, aggressive execution, GEX support — all pointing the same direction.
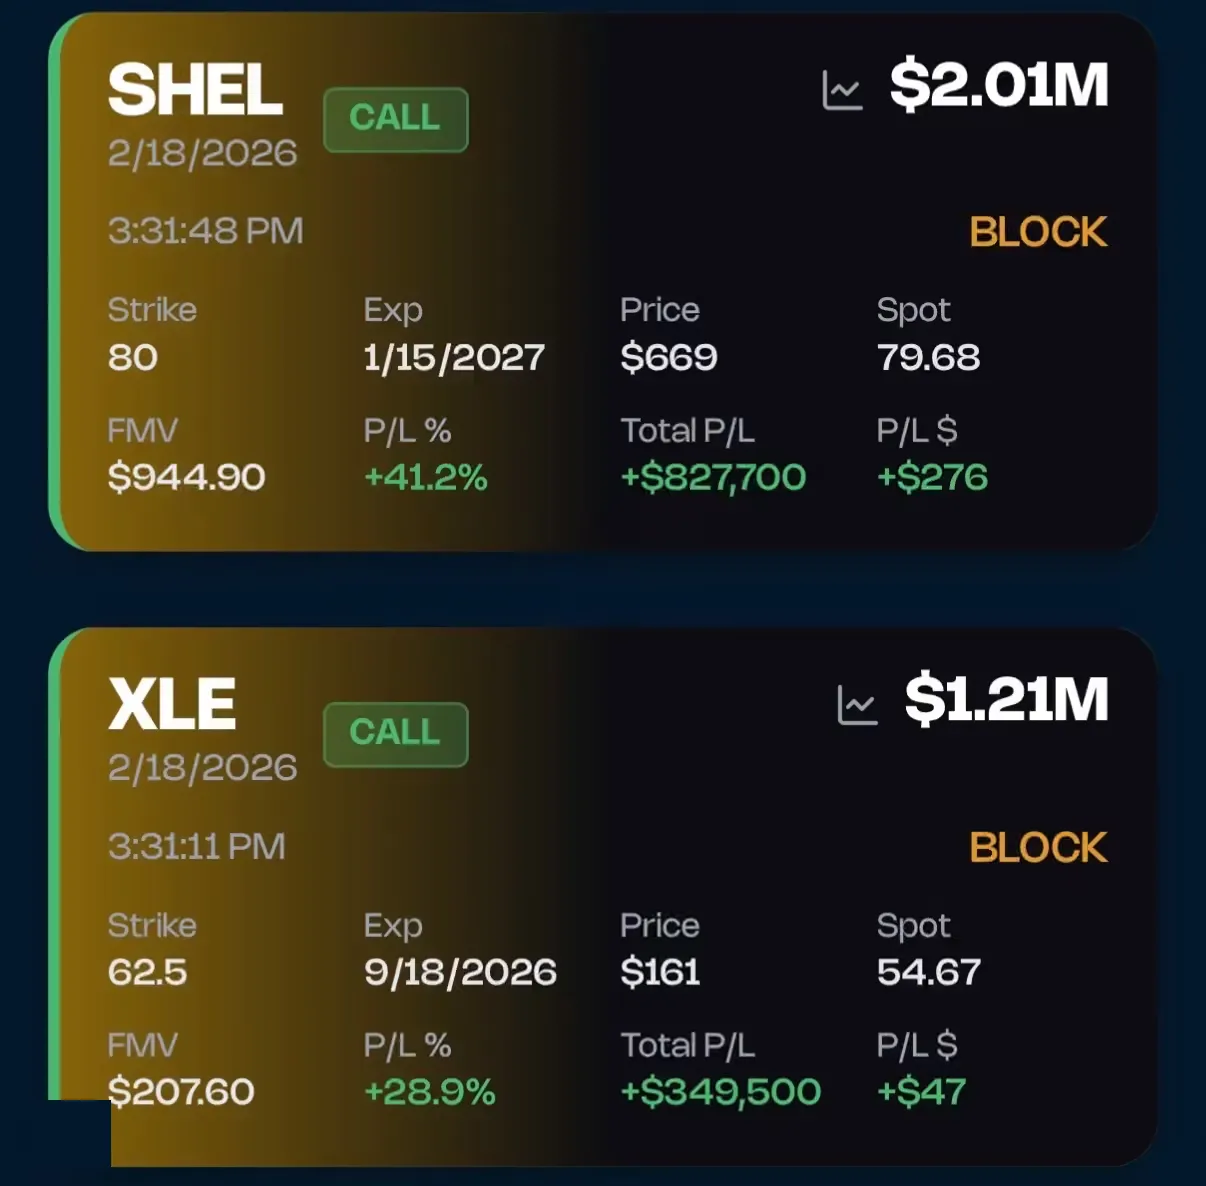
You check the Unusual Activity feed filtered by High Conviction — the highest-conviction signals that meet multiple criteria simultaneously. There's your ticker. And two related names in the same sector, also showing institutional-size flow. This isn't noise. This is confluence.
High Conviction Signal Filter combines aggression, size, and unusual volume into a single high-signal view.
Sector alignment — when related tickers show similar flow, it confirms directional conviction, not isolated noise.
The Result: How the Trade Played Out
You made your call. The position is tracked. Days later, you check back. The trade detail view shows real P/L from entry to exit, visible on any past flow signal. You see exactly how the position performed — not speculation, not backtested theory, but actual results from the live feed.
This particular signal delivered +871% — $1.4M profit on a position that started with institutional flow, aligned GEX, and High Conviction filter confirmation. Not every signal works this cleanly. But when the layers align, you had the tools to see it developing.
Real P/L tracking on every flow signal. No retroactive cherry-picking. You see the winners and the losers.
Historical validation — review past signals to understand what worked, what didn't, and why.
See your journey unfold
The best way to understand the flow is to follow it yourself. Experience the journey from signal to decision.
Cancel anytime. No commitment.