Gamma Exposure
(GEX) Tools
GEX reveals the mechanical price levels where market maker hedging creates support and resistance. Options Flow delivers this analysis in four visualization modes with real-time updates, expiration filtering, and overlays on live candlestick charts — designed for active trading workflows.
The hidden force shaping price action
Gamma Exposure measures the net gamma held by market makers at each strike price. When market makers sell options, they take on gamma risk and must continuously hedge their exposure by buying and selling the underlying — a process that mechanically influences price and defines how gamma measures translate into real market movement.
At strikes with high positive GEX, dealer hedging creates a dampening effect — price tends to get pinned. At strikes with high negative GEX, dealer hedging amplifies moves, creating a force multiplier on volatility. Understanding this dynamic is understanding the market's structural gravity.
Learn more in the Gamma Exposure glossary entry , or try the free GEX analyzer tool .
What GEX reveals
Key support & resistance levels
Strikes with the highest absolute GEX act as mechanical price magnets. Market makers are forced to buy when price falls below and sell when it rises above — creating real support and resistance.
Potential pin points
Heading into expiration, positive GEX zones pull price toward the strike with maximum gamma. Understanding this prevents you from fighting mechanical forces.
Volatility regime shifts
Negative GEX means dealers amplify moves. Positive GEX means they dampen them. Knowing which regime you're in tells you whether to expect mean-reverting or trending behavior.
Eight metrics, always visible
The GEX dashboard surfaces the numbers that matter — current price, gamma flip, call wall, put wall, net GEX, max exposures, and expected move. No hunting through tables or menus. These metrics are always present, always updated.
Gamma Flip
The price level where dealer hedging flips from dampening to amplifying. Includes % distance from current price.
Call Wall
Resistance level with highest positive GEX. Shows absolute gamma value and % distance. This is where dealers defend against upside.
Put Wall
Support level with highest negative GEX. Absolute gamma and % distance. Dealers defend against downside here.
Net GEX
Total gamma exposure across all strikes. Color-coded: green (positive, dampening), red (negative, amplifying).
Max +GEX
Highest positive gamma at a single strike. The strongest mechanical pin point in the chain.
Max -GEX
Most negative gamma at a single strike. If price breaks here, dealer hedging amplifies the move.
Expected Move
IV-derived 1-day expected range. Upper and lower bounds visualized as bands on charts. Probability-weighted, not guesses.
Put/Call Sentiment
Visual sentiment bar comparing put vs call gamma. Quick gauge of overall dealer positioning skew.
Four ways to see GEX
Different traders think differently. Options Flow gives you four visualization modes for the same underlying data — table, bar chart, heatmap, and the real differentiator: GEX overlaid directly on candlestick charts.
Table View
Sortable strike-by-strike data with GEX values, visual mini-bars, Call OI, Put OI, and Total OI. Color-coded rows by key level type (flip, wall, expected move). Best for scanning exact numbers.
Bar Chart
Horizontal diverging bars. Green (positive/calls) extend right, red (negative/puts) extend left. Annotation lines for spot, gamma flip, call wall, put wall, and expected move band. The classic GEX visualization.
Heatmap
Strike x expiration 2D grid with diverging red-to-green color scale. Each cell intensity maps to gamma exposure at that strike/expiration combo. Spot where dealers are concentrated at a glance — unusual heat reveals positioning before you read a single number. Shows support/resistance clusters across the full chain.
Candlestick + GEX Overlay
TradingView-powered candlestick chart with GEX strike bars and key levels overlaid directly on price. Multiple timeframes (1m to 1d). Toggleable overlays: moving averages, volume, GEX bars, key levels. This is where price action meets dealer positioning.
See the Whole Board at Once
Tables make you read. Heatmaps make you see. The GEX heatmap displays strike-by-expiration gamma exposure as a two-dimensional color grid. Hot spots reveal positioning concentration before you read a single number. Your visual cortex processes this faster than scanning rows of text ever could.
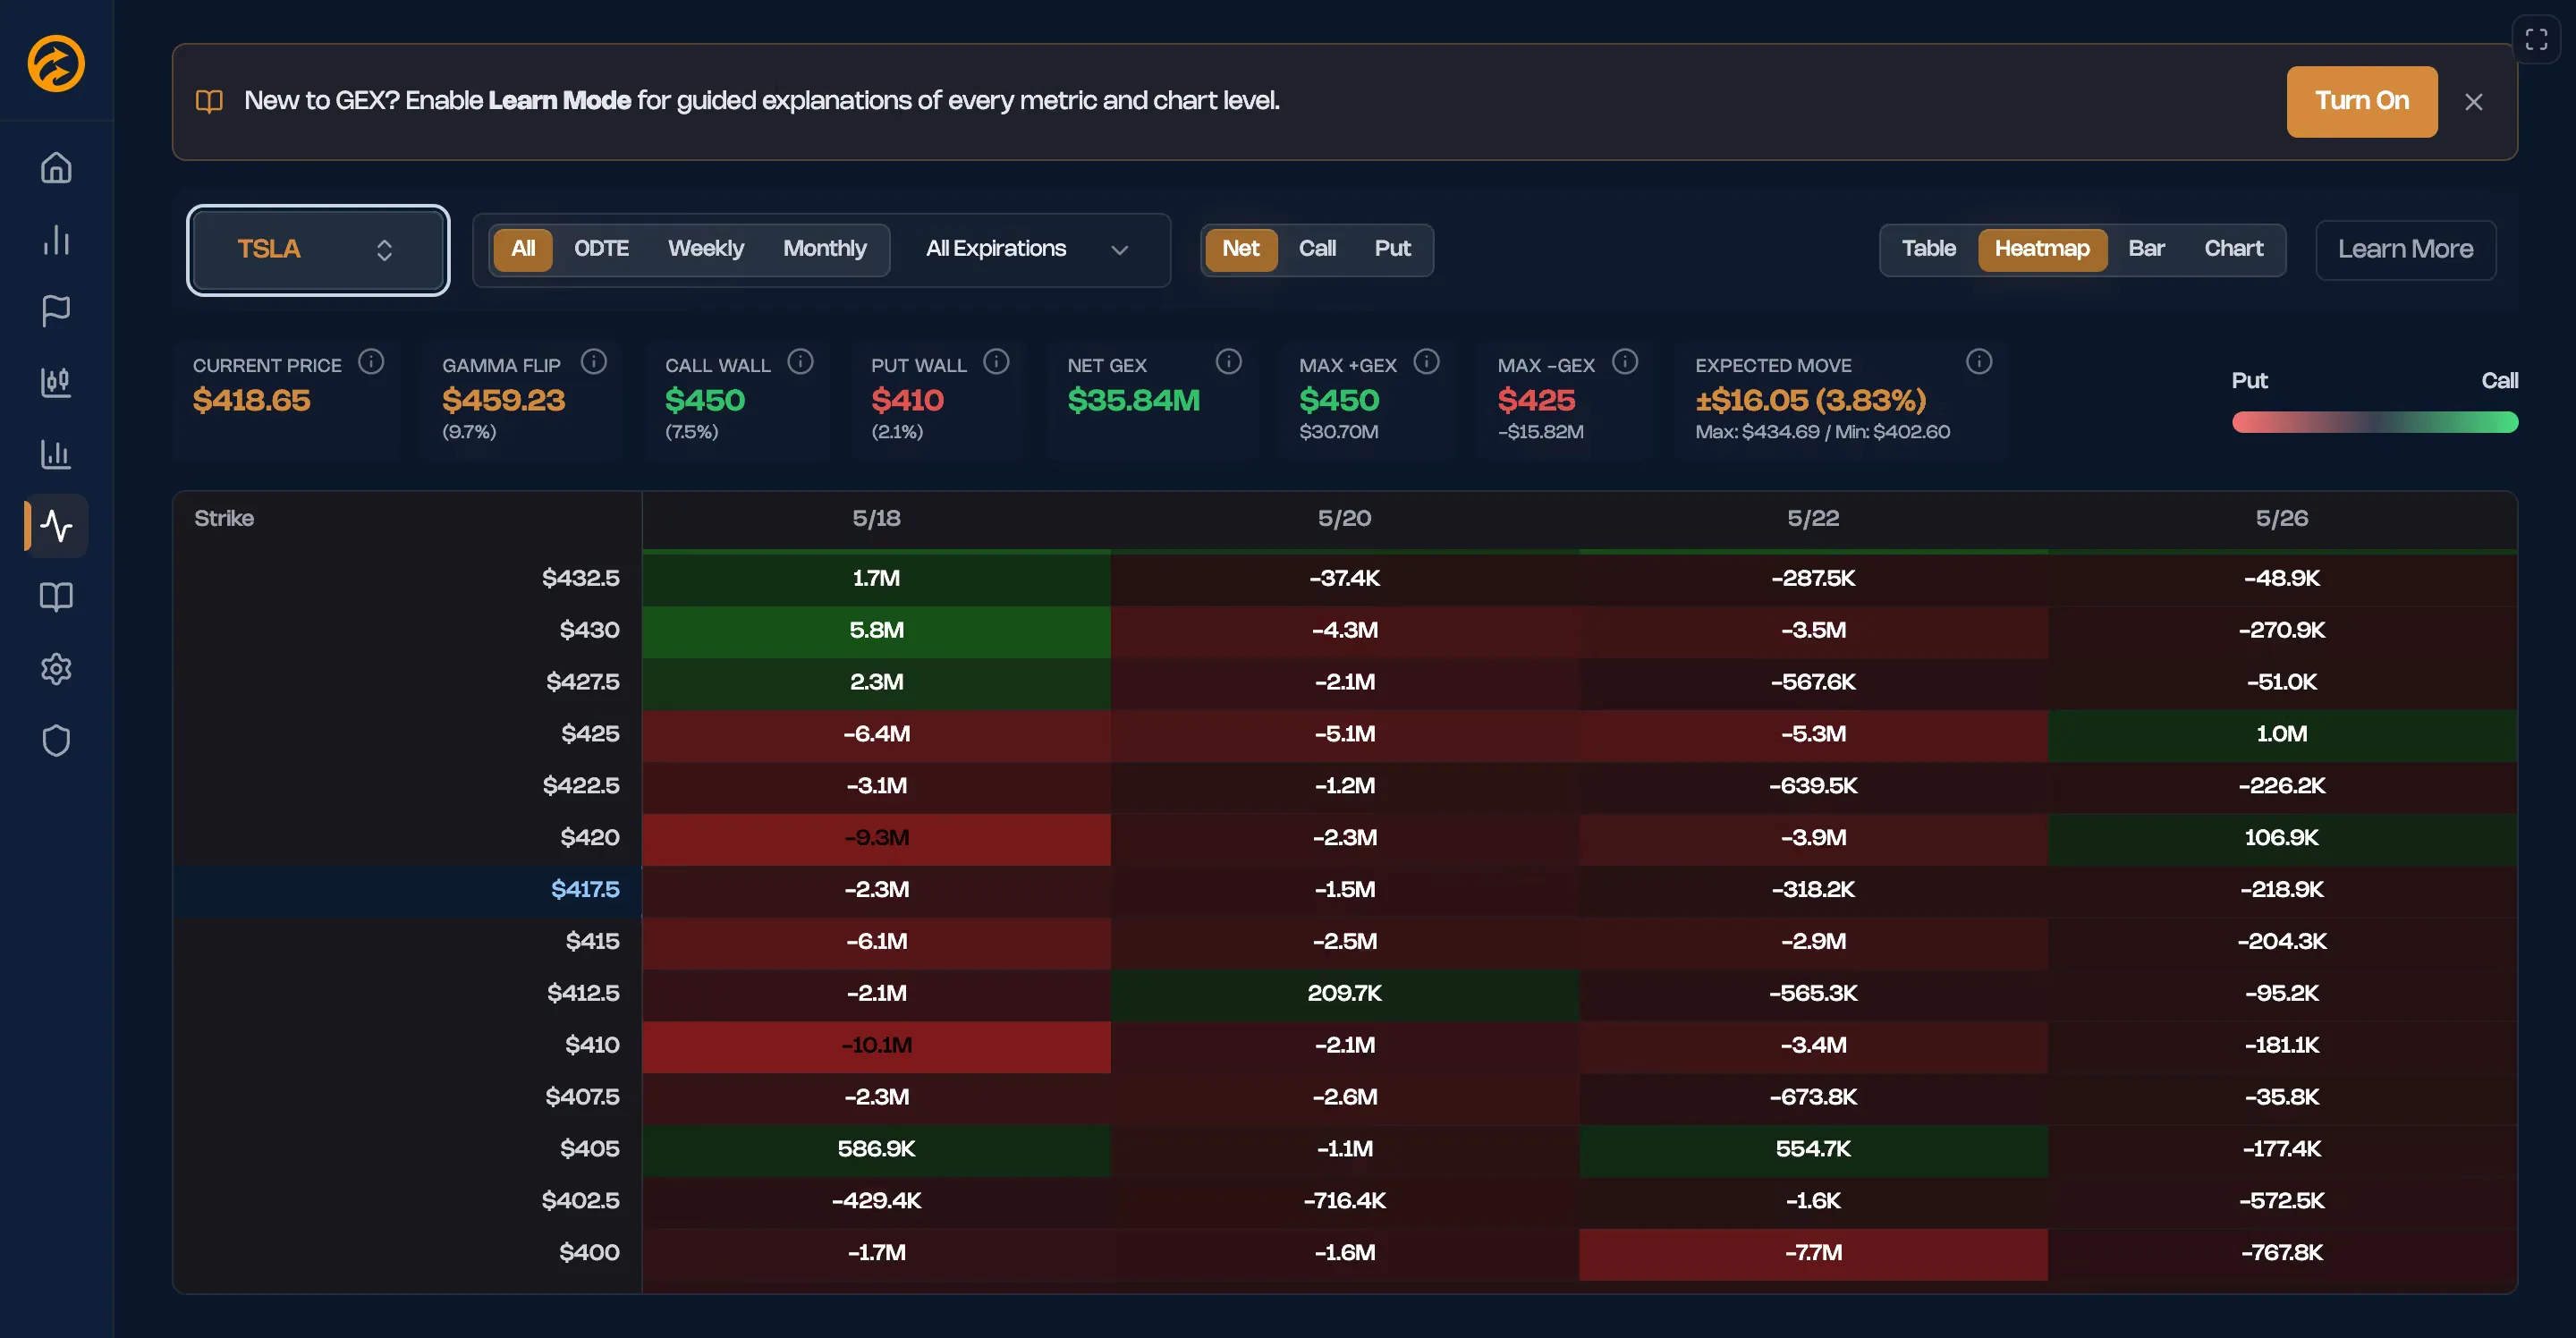
TSLA GEX heatmap - data-only view with strike-by-expiration grid
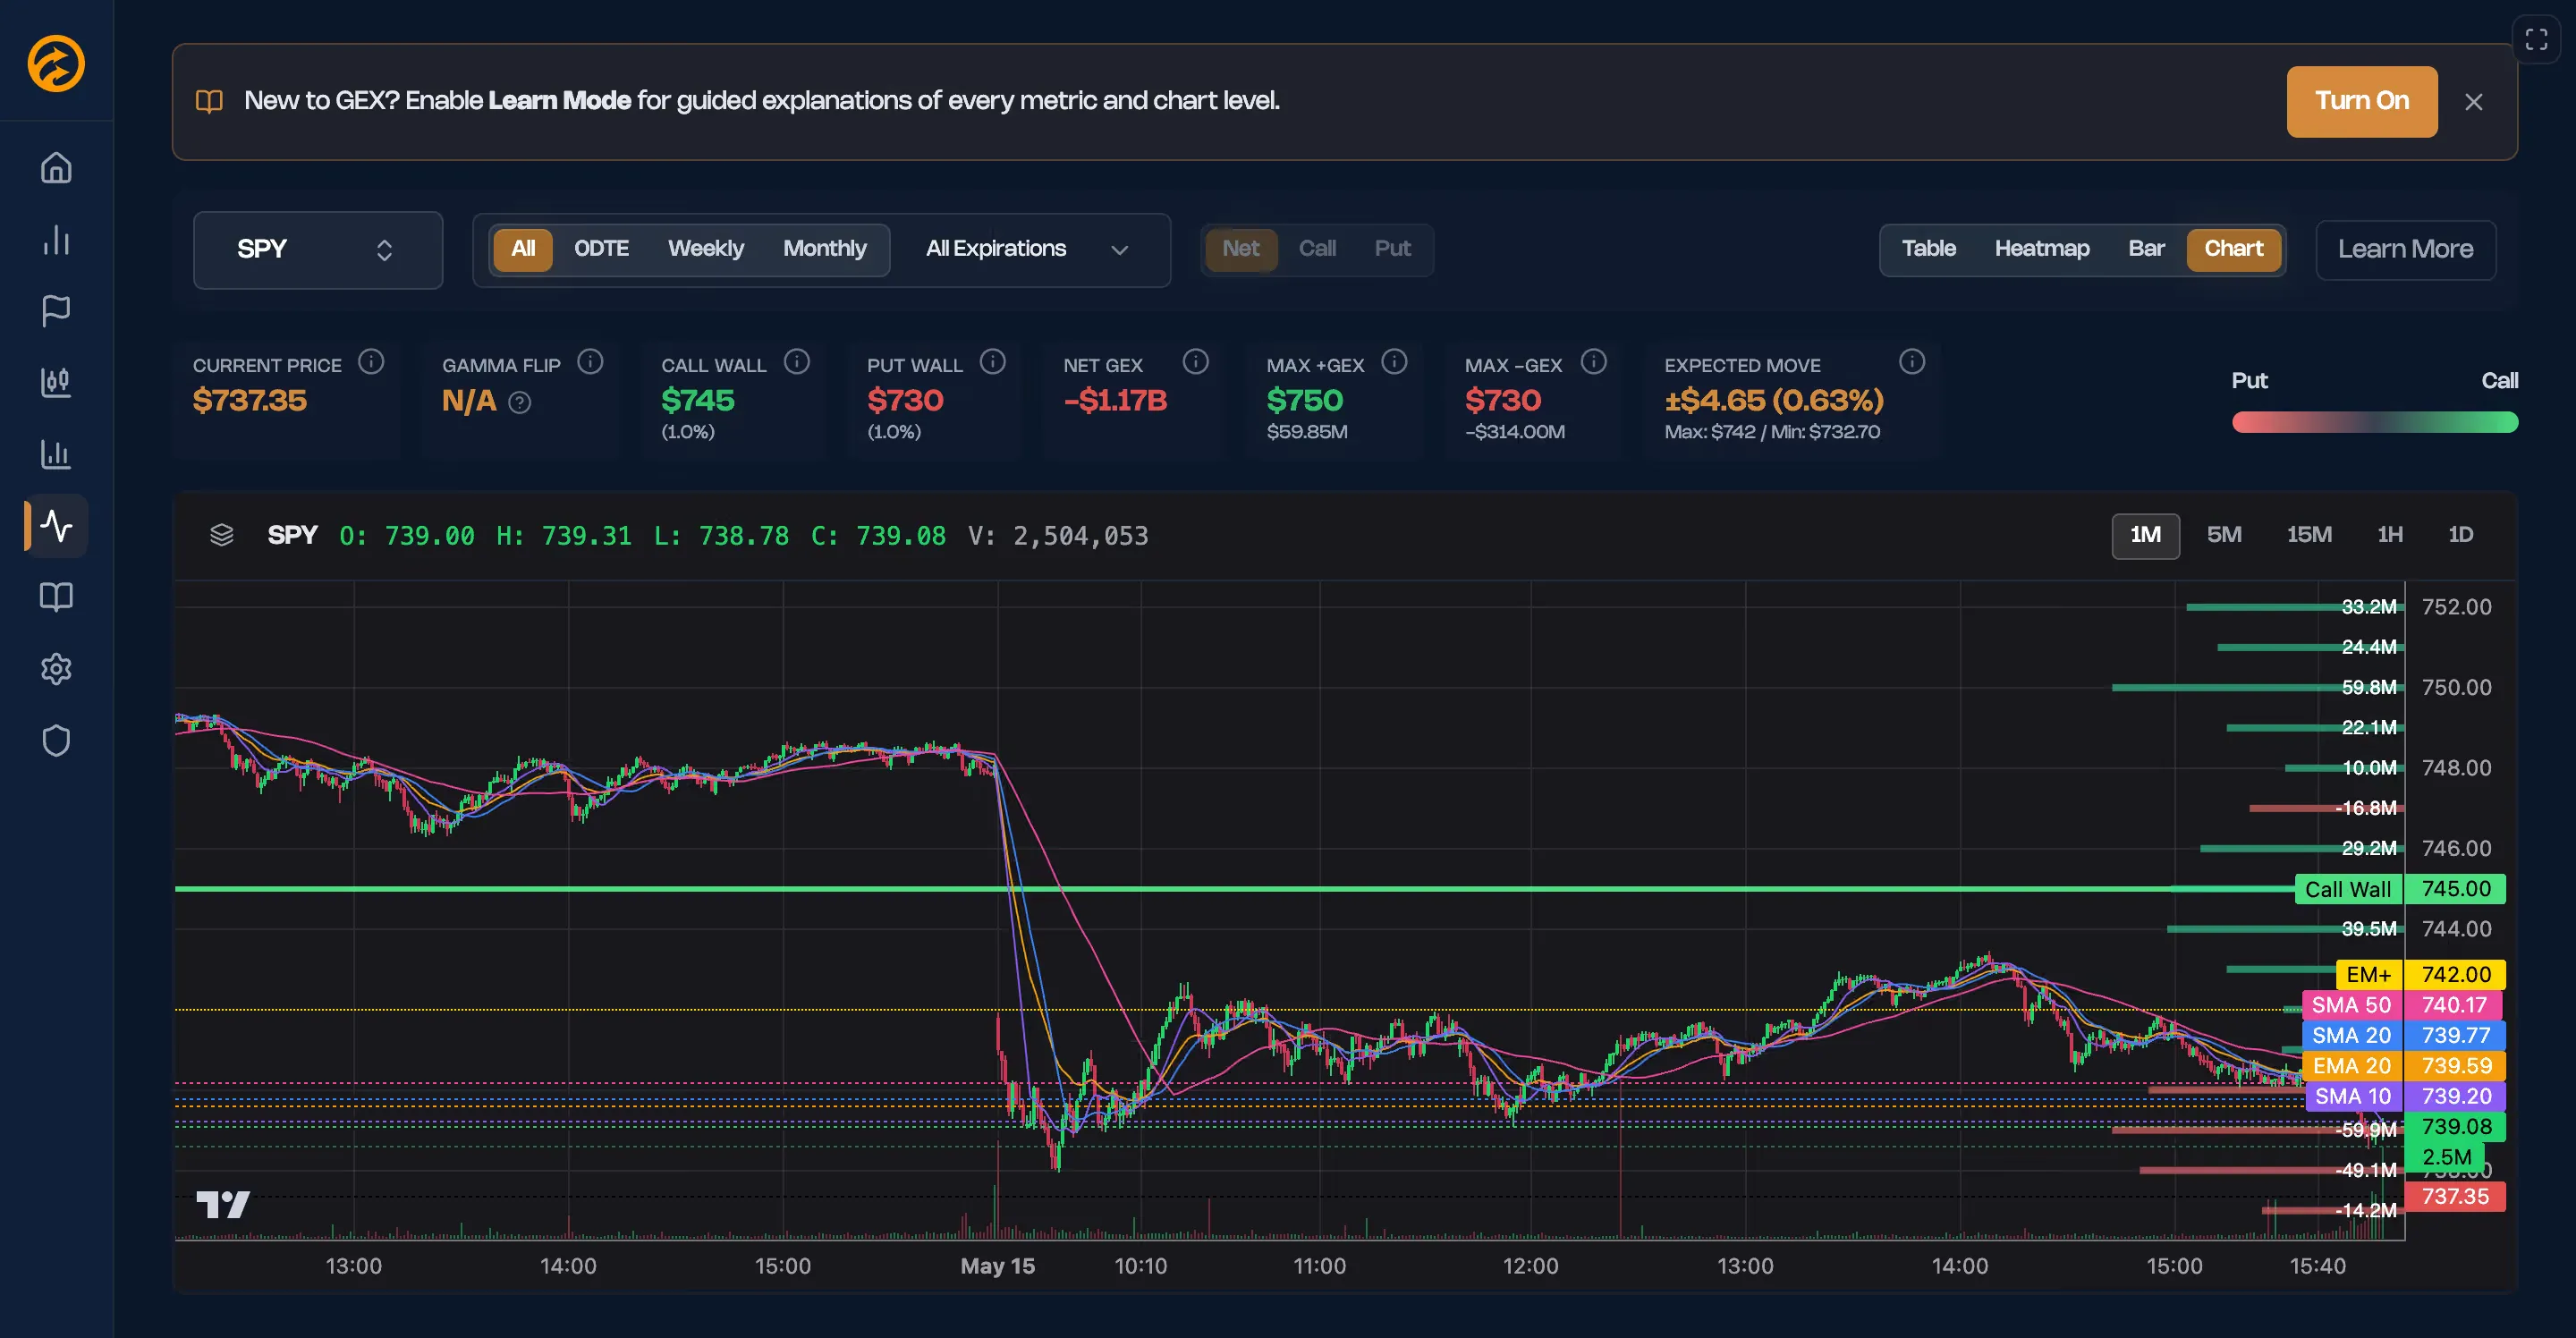
Candlestick + GEX overlay - price action with key levels and dealer positioning
The visual edge
Why heatmaps beat tables for gamma exposure analysis.
Instant pattern recognition
Unusual heat on a normally quiet strike jumps out immediately. No scanning row by row. Your visual system identifies anomalies faster than reading ever could.
Expiration concentration
When dealers concentrate positioning around a specific expiration, the heatmap shows vertical columns of intense color. Pattern visibility reveals structural positioning.
Strike clustering
Horizontal bands of color reveal strikes where gamma concentrates across multiple expirations. These are the levels that matter — mechanical support and resistance.
Pre-event positioning
Before earnings or economic data, concentrated heat at specific strikes shows where hedging and speculative positioning has accumulated. The market reveals expectations visually.
Interactive features
Visual overview with drill-down detail.
Click to inspect
Click any cell to see exact GEX value, strike, and expiration. Hover for quick tooltips. Visual overview, precise data on demand.
Expiration filtering
Filter to specific expirations (0DTE, Weekly, Monthly) or view all at once. Heatmap auto-recalculates to show selected timeframe.
Strike range zoom
Focus on specific price ranges. Zoom in on ATM strikes or zoom out to see the full chain. Density controls adjust cell granularity.
Color scale modes
Switch between diverging (positive/negative) and sequential (absolute magnitude) color scales. Different modes reveal different patterns.
Key level overlay
Gamma flip, call wall, put wall, and expected move boundaries overlaid on the heatmap grid. See where key levels align with heat concentration.
Mobile-optimized
Responsive grid layout adapts to mobile screens. Touch interactions for drill-down. Full heatmap functionality on any device.
The details matter
GEX tools are simple to use, but there's depth beneath the surface. Expiration filtering, contextual education, interactive legends, auto-refresh — these aren't extras. They're what makes the difference between a toy and a professional tool. Understand the mechanics deeper in the GEX levels guide or the how to read GEX charts walkthrough.
Expiration Filtering
View GEX for All expirations, 0DTE only, Weekly, Monthly, or drill into a specific expiration date. Key levels auto-recalculate instantly. Client-side filtering — no reload, no lag.
Learn Mode
Toggleable inline educational content that adapts to the current chart type. Not a separate help page — contextual explanations built directly into the dashboard. Learn while you trade.
Interactive Legend
Hover a level in the legend (gamma flip, call wall, put wall) and the corresponding line on the chart highlights. Small detail, massive usability improvement.
Auto-Polling
GEX data refreshes every 60 seconds automatically during market hours. You don't have to remember to refresh. Dealer positioning is dynamic — your data should be too.
Ticker Search
Quick access to popular tickers (SPY, QQQ, IWM, AAPL, NVDA, TSLA) plus search for any optionable underlying. If it has options, it has GEX.
Full Mobile Layout
Chart-focused layout optimized for mobile screens. Full-screen chart mode with swipeable chart types, bottom sheet controls, and coach marks. Key metrics displayed above the chart. Designed mobile-first, not desktop-adapted.
See GEX in Action
The chart below shows what a real GEX profile looks like for SPY. Hover over bars to see strike-level detail. This is the same visualization you'll have access to in Options Flow — updated in real-time throughout the trading day.
Key GEX Levels
SPYFeb 20, 2026
What is GEX?expand
Gamma Exposure (GEX) measures the net options gamma held by market makers at each strike price, expressed in dollars. When dealers are long gamma (positive GEX), they hedge by selling into rallies and buying dips — mechanically dampening volatility and creating price resistance zones. When dealers are short gamma (negative GEX), their hedging amplifies moves in both directions, turning those strikes into volatility acceleration zones. Understanding the GEX profile lets traders identify which price levels will act as magnets, walls, or launching pads before they're tested.
This is a point-in-time snapshot. Live GEX updates in real-time throughout the trading day.
Access Live GEX Data → Get StartedData shown is a point-in-time snapshot for illustration. Live GEX updates throughout the trading day.
How traders use GEX tools
Understanding dealer hedging flows changes how you interpret price action. Read the full breakdown in GEX and Options Flow together.
Spotting mechanical walls before entry
Check the candlestick view with GEX overlay before entering. If you're buying calls and the call wall is 2 strikes above, you're trading into a mechanical ceiling.
Reading regime shifts from Net GEX
Green (positive) means dealers dampen moves — expect mean reversion. Red (negative) means they amplify — expect trending behavior.
Pre-event positioning via heatmap
Before earnings or economic data, concentrated heat at specific strikes reveals where the market expects movement or is most defended.
Combining GEX with flow signals
Large call sweeps in the flow scanner plus concentrated positive GEX at that strike equals confluence. Dealer positioning and smart money aligned.
Learn the Concepts
Understand the concepts behind gamma exposure analysis:
Learn How to Use GEX in Your Trading
Master gamma exposure analysis with our complete educational series.
What is Gamma Exposure (GEX)?
Complete guide to understanding GEX, market maker hedging, and how gamma exposure drives price behavior.
GEX Levels Explained
Understand positive vs negative GEX, the zero line, call walls, put walls, and how they act as support/resistance.
How to Read GEX Charts
Step-by-step tutorial on interpreting GEX charts, identifying key zones, and spotting common patterns.
GEX Trading Strategies
Practical frameworks for using GEX in your trading: intraday setups, OPEX plays, and volatility expansion trades.
Frequently Asked Questions
Gamma Exposure measures the net gamma held by market makers at each strike price. When market makers sell options, they must continuously hedge their gamma risk by buying and selling the underlying asset — a process that mechanically influences price. GEX quantifies this hedging pressure at every strike, revealing where dealers are forced to buy or sell.
At strikes with high positive GEX, dealer hedging creates a dampening effect — they buy when price falls and sell when it rises above the strike, pinning price. At strikes with high negative GEX, dealer hedging amplifies moves in the direction of price travel. These mechanical forces create real, measurable support and resistance that isn't visible in traditional chart analysis.
The gamma flip (also called the zero GEX level) is the price where net dealer gamma exposure crosses from positive to negative. Above the flip, dealers dampen volatility and price tends to mean-revert. Below it, dealers amplify moves and trending behavior dominates. Options Flow always shows the gamma flip level and its distance from the current price.
Traditional technical analysis identifies support and resistance from historical price patterns — levels where price has bounced or broken before. GEX reveals mechanical support and resistance created by dealer hedging obligations, which exist regardless of historical price behavior. These levels are structural and forward-looking, based on where dealers must buy and sell as price moves.
Trade with the structure, not against it
GEX Tools are included in every Options Flow plan.
Cancel anytime. No commitment.